MT4 & MT5 Report Analyzer — Free, No Account
Stop guessing.
Stress-test your strategy right now.
Don't settle for MetaTrader's basic summary. Upload your raw .htm report to instantly reconstruct every drawdown episode, unlock institutional-grade risk metrics, and run a 1,000-path Monte Carlo simulation. See if your edge is actually real.
Nothing to install. Free to use.
Zero downloads. Drop your file and your dashboard renders in seconds.
Generate a permanent, verifiable link to share your performance with investors or communities.
From basic profit factors to 1,000-path Monte Carlo simulations.
Dashboard Overview
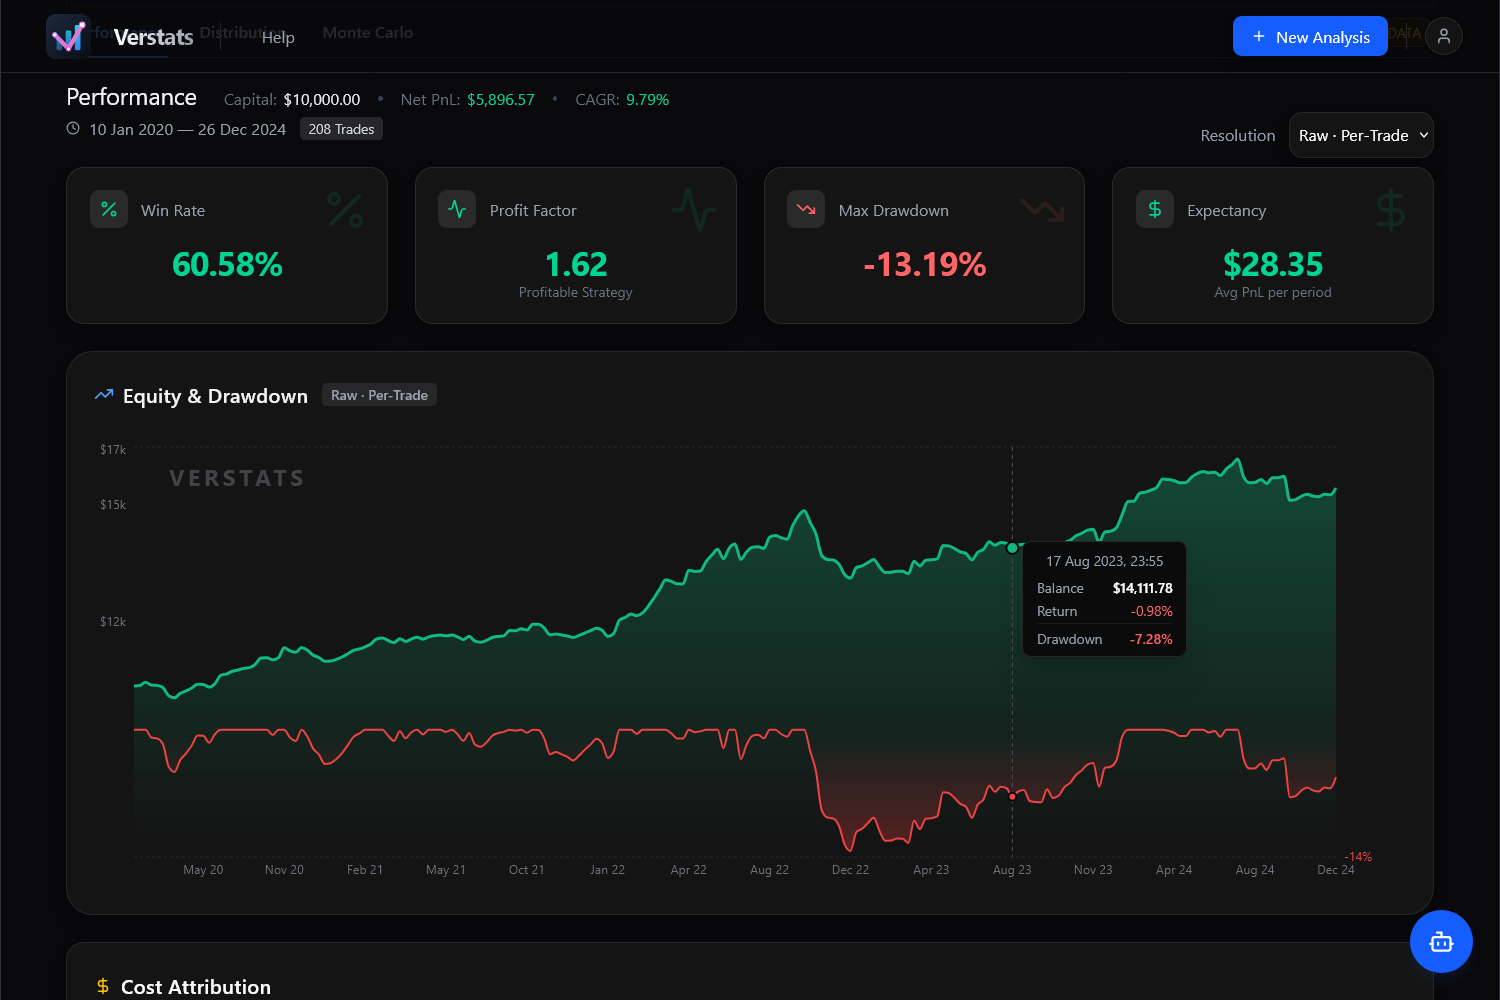
Dashboard Overview
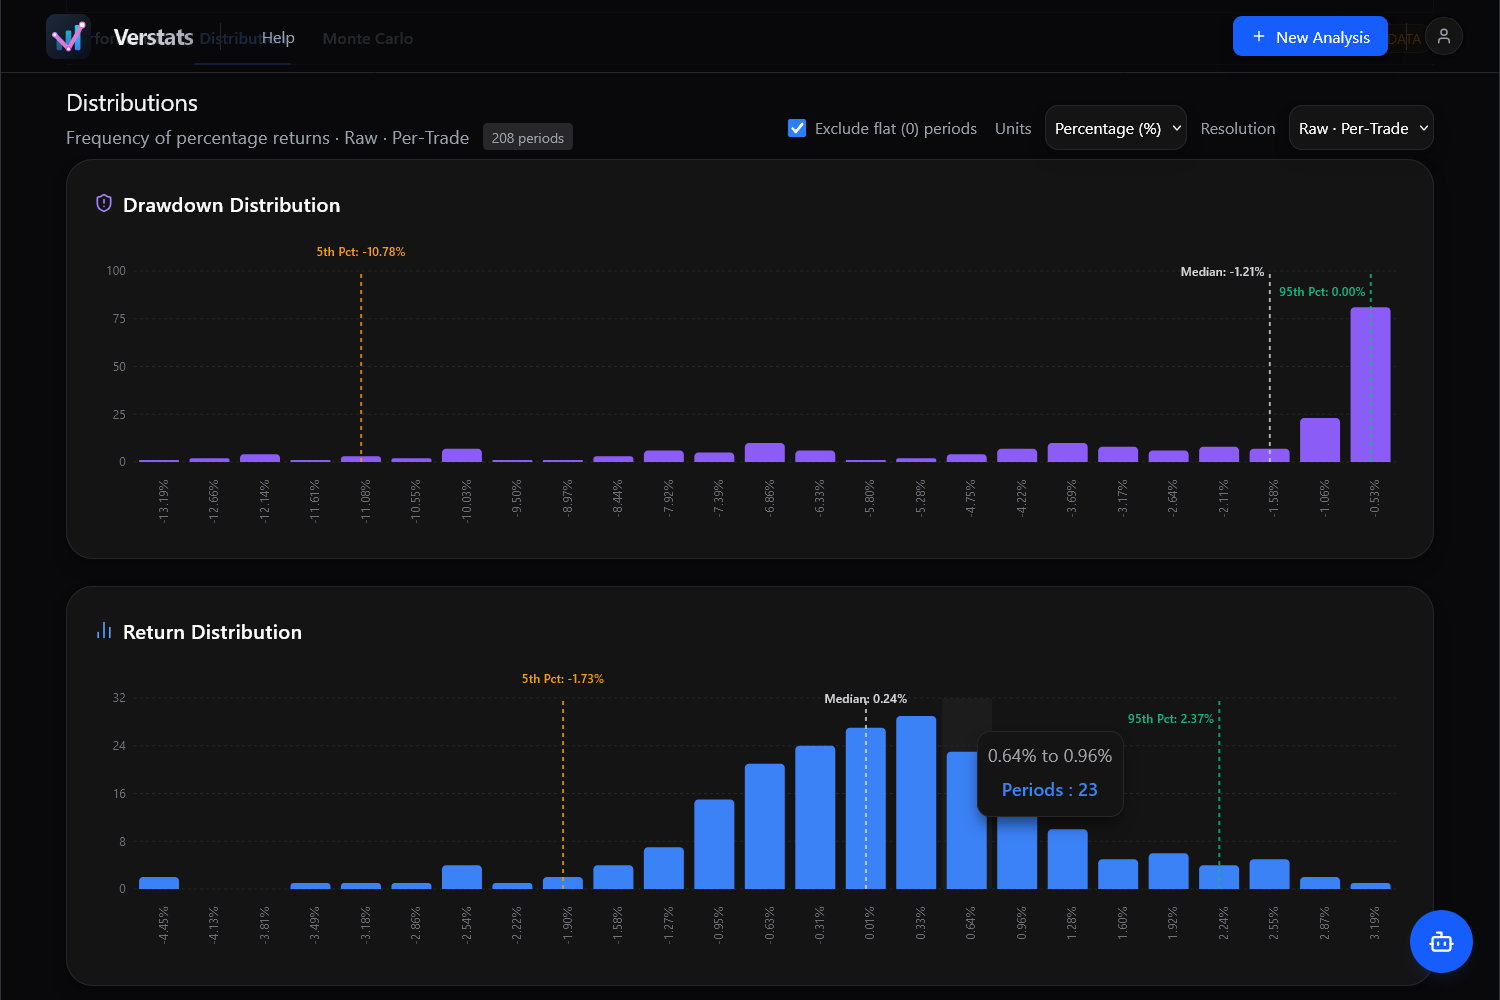
Visualise Distributions
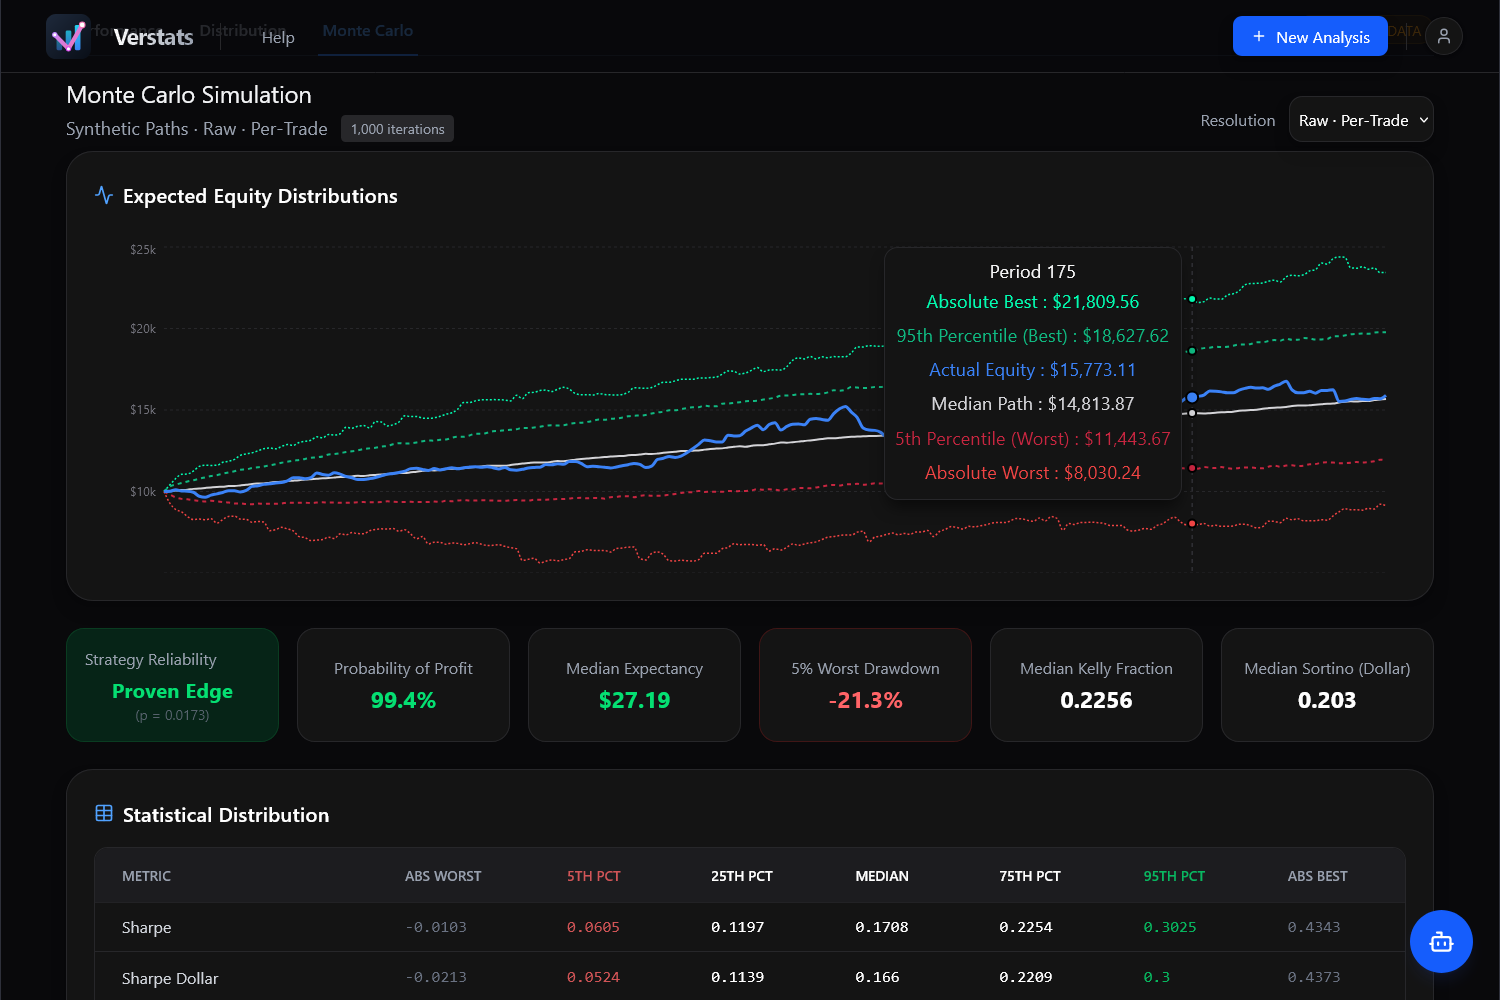
Deep-dive into trade simulations
The Gap
One file. Two very different pictures.
The MetaTrader report was built to summarise a trading log, not to stress-test a strategy. It gives you enough to feel confident and not nearly enough to be right.
In MT4/5
- Total net profitraw
- Profit factorraw
- Maximal drawdownone number
- Expected payoffraw
- Consecutive winsraw
A flattering summary of the past.
Verstats
- Every drawdowndepth & time
- Sharpe & Sortinorisk-adjusted
- Swap drag% of net
- Monte Carlo1,000 paths
- p-valuesignificance
An estimate of what happens next.
The Output
Metrics grouped by the question they answer.
A number on its own is trivia. Each statistic below is here because it answers something you can act on — keep trading it, size it differently, or throw it away.
Is the edge real?
PERFORMANCEAverage net PnL per trade — the actual figure that survives resizing.
CATCHES OVER-LEVERAGEReturns measured against total volatility and downside deviation.
CATCHES WILD SWINGSMathematical proof that your record is statistically distinguishable from pure luck.
CATCHES LUCKThe exact shape of your returns. Are you grinding steady gains or relying on massive outliers?
OUTLIER DEPENDENCYThe maximum, average, and median consecutive runs in both directions.
TILT TRIGGERSYour total return measured directly against the worst drawdown you sat through.
REWARD-TO-PAINWhat is killing your strategy?
RISK & COSTSEvery single peak-to-recovery cycle isolated, not just a single worst-case figure.
THE OTHER 31 DRAWDOWNSMaximum, average, and median time spent underwater before making a new high.
DEAD PERIODSDrawdown depth and duration mathematically combined into a single pain metric.
SLOW BLEEDSThe exact percentage of your bottom line surrendered to broker fees.
OVERTRADINGThe hidden cost of holding positions overnight, routinely ignored in backtests.
CARRY DRAGMaximum and median wait times between closed positions. Can you sit on your hands?
STRATEGY DROUGHTSWhat happens next?
SIMULATIONSBest, 95th, 50th, 5th, and worst equity paths from 1,000 reshuffled histories.
SEQUENCE RISKThe absolute percentage of your simulated 1,000 paths that managed to finish above water.
RUIN PROBABILITYThe catastrophic drawdown you must size your account to survive, not the one you got lucky with.
UNDERSIZED ACCOUNTSThe mathematical ceiling on position sizing that your simulated edge actually supports.
ACCOUNT BLOW-UPSA stress-tested statistical significance score, stripping away the luck of your specific trade order.
FALSE CONFIDENCE1,000-path distributions (Worst to Best) for over 20 metrics, including Sharpe, Sortino, and Streaks.
BEST & WORST CASESThe Process
Three steps, thirty seconds.
Export
In MetaTrader, right-click the account history or Strategy Tester results and choose Save as Report. You get an .htm file.
Drop
Drag it into Verstats. The parser reads the raw trade table — every ticket, price, commission and swap — not just the summary.
Read
The full statistic set renders immediately, with every figure traceable back to the trades in the blotter that produced it.
How access works
Try it without an account. Sign up free when you want simulations, larger reports, or your history kept.
More Information
Without an account
No signup, nothing stored
- +One report per day
- +Reports up to 500 trades
- +Core stats, charts and dashboard
- −No Monte Carlo simulations
- −Nothing saved — closing the tab loses your report
Free account
Signup, no card
- +Your reports saved and shareable — come back to them any time
- +Monte Carlo simulations unlocked
- +Any report size — no trade cap
- +1,000,000 tokens, refilling at 7,500/hour
Token packs
One-time, no subscription
- +Everything in the free account
- +Tokens never expire
- +Free balance always spent first
- +Larger packs cost less per token
Find out what your report left out.
Bring a strategy you already trust. Those are the interesting ones.
Analyze a report →